Customer Perceived Value (CPV)
Customer Perceived Value (CPV) is a conceptual marketing model used to determine the difference between a prospective customers evaluation of all the costs and benefits of a company's offering and the perceived alternatives.

What it is
CPV is a means by which marketers can employ market research to discover customer preferences. The result is derived by comparing the total customer benefit to the total customer cost. The outcome of this exercise is a customer-perceived value offering, with quality and financial attributes that can be used to design new products and services that will be attractive to the market.
Background
Over the last few decades, largely driven by the widespread adoption of online trading, most businesses have experienced an environmental shift away from a seller's market towards one where buyers hold the power. The buyer heavily influences value within this marketplace, primarily due to increased supplier choice, customer service and demand for value for money. As a result of this marketplace evolution, marketers have found it increasingly necessary to offer buyers precisely what they want if they are to build a profitable business.
Since its introduction, CPV has become an essential tool for marketers to help them make sense of their research by taking both the product and service demands of customers into account.
When to use it
- CPV is a valuable tool when designing products and services for introduction to the market.
- Analysis of CPV is often used to compare a product's strengths and weaknesses relative to its competitors.
How to use it
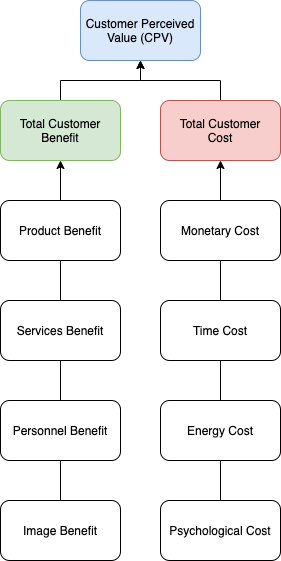
CPV is a measure of the perceived difference between total customer benefit and total customer cost. CPV can therefore be expressed as:
Customer Perceived Value = Total Customer Benefit - Total Customer Cost
Total Customer Benefit is determined by evaluating the following items:
- Product benefit - the basic attributes of the product such as quality, design, functionality, packaging and cost savings.
- Services benefit - the support services offered alongside the product. These may include pre-sales and post-sales customer services such as delivery, installation, warranties, servicing and guarantees.
- Personnel benefit - the value added by company representatives during the sales process to overcome customer objections and facilitate a sale.
- Image benefit - the perceived value to a customer of increased image and reputation achieved by being seen to own and use the product. Image benefit is often gained directly as a result of enhanced brand equity.
Total Customer Cost is comprised of the following elements:
- Monetary cost - the price paid for the product or service by the customer.
- Time cost - the cost to the customer in time spent in the decision making and buying process such as searching, evaluating, purchasing and delivery lead times.
- Energy cost - the degree of physical effort expended by the customer while searching for, evaluating, buying, installing, using and receiving delivery of the product.
- Psychological cost - the cost related to any dissatisfaction and frustration experienced by the customer during the evaluation and purchasing journey.

Once the CPV for any particular product or service has been established, identical assessments should be made of competitors associated offerings to determine how they will compare in customers' minds.
Any company that finds one or more of their products to have a lower CPV than their competitors may either increase total customer benefit or decrease total customer cost to gain a preferential customer value perception.
Frequently asked questions (FAQs)
Does the Personnel Benefit element still apply for online-only businesses?
In many modern businesses, products are sold online without the customer ever interacting directly with personnel from the seller's business. However, this does not mean that the Personnel Benefit CPV element should be ignored. Instead, businesses should focus on the user experience of the buying process, ensuring that it is as pleasant and frictionless as possible and that the user can easily access the information they need to facilitate their purchase. For example, could the further information be displayed on-screen, or would users benefit from real-time chat or customer reviews?
Related models

Further reading
Aulia, S., Sukati, I. and Sulaiman, Z. (2016) A Review: Customer Perceived Value and its Dimension. Asian Journal of Social Sciences and Management Studies, 3(2) 150-162. Available from https://www.researchgate.net/publication/327574415_A_Review_Customer_Perceived_Value_and_its_Dimension [accessed 25 August 2021].
Kotler, P., Keller, K. L., Brady, M., Goodman, M. and Hansen, T. (2019) Marketing Management, 4th European edition. Harlow, UK: Pearson Education.
Yang, Z. (2004) Customer perceived value, satisfaction, and loyalty: The role of switching costs. Psychology & Marketing, 21(10) 799-822. Available from https://www.academia.edu/4928464/Customer_perceived_value_satisfaction_and_loyalty_The_role_of_switching_costs [accessed 25 August 2021].
Some of the links to products provided in this article are affiliate links. This means that the supplier may pay the owner of this website a small amount of money for purchases made via the link. This will have absolutely no impact on the amount you pay.


